
gpOptimizer: Mini Application#
## First, install the right version of gpCAM, and matplotlib
#!pip install gpcam==8.4.0
#!pip install matplotlib
Setup#
import numpy as np
import matplotlib.pyplot as plt
from gpcam import GPOptimizer
import time
from itertools import product
x_pred1D = np.linspace(0,1,1000).reshape(-1,1)
Data Prep#
x = np.linspace(0,600,1000)
def f1(x):
return np.sin(5. * x) + np.cos(10. * x) + (2.* (x-0.4)**2) * np.cos(100. * x)
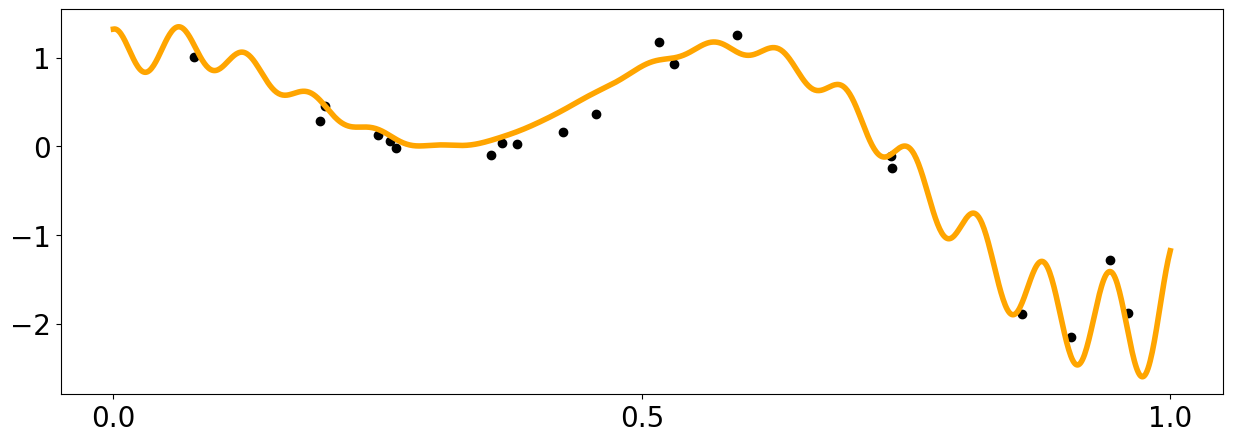
x_data = np.random.rand(20).reshape(-1,1)
y_data = f1(x_data[:,0]) + (np.random.rand(len(x_data))-0.5) * 0.5
plt.figure(figsize = (15,5))
plt.xticks([0.,0.5,1.0])
plt.yticks([-2,-1,0.,1])
plt.xticks(fontsize=20)
plt.yticks(fontsize=20)
plt.plot(x_pred1D,f1(x_pred1D), color = 'orange', linewidth = 4)
plt.scatter(x_data[:,0],y_data, color = 'black')
<matplotlib.collections.PathCollection at 0x7ff478b37550>
GP Setup#
my_gp = GPOptimizer(x_data,y_data,)
my_gp.train()

train_at = [10,20,30] #optional
for i in range(100):
    new = my_gp.ask(np.array([[0.,1.]]))["x"]
    my_gp.tell(new, f1(new).reshape(len(new)))
    if i in train_at: my_gp.train()
/home/marcus/Coding/fvGP/fvgp/gp.py:375: UserWarning: Hyperparameters initialized to a vector of ones.
  warnings.warn("Hyperparameters initialized to a vector of ones.")
/home/marcus/Coding/fvGP/fvgp/gp.py:406: UserWarning: No noise function or measurement noise provided. Noise variances will be set to (0.01 * mean(|y_data|))^2.
  self.likelihood = GPlikelihood(self.data,
/home/marcus/Coding/fvGP/fvgp/gp.py:759: UserWarning: Default hyperparameter_bounds initialized because none were provided. This will fail for custom kernel, mean, or noise functions
  warnings.warn("Default hyperparameter_bounds initialized because none were provided. "
#let's make a prediction
x_pred = np.linspace(0,1,1000)
mean1 = my_gp.posterior_mean(x_pred.reshape(-1,1))["m(x)"]
var1 = my_gp.posterior_covariance(x_pred.reshape(-1,1), variance_only=False, add_noise=True)["v(x)"]
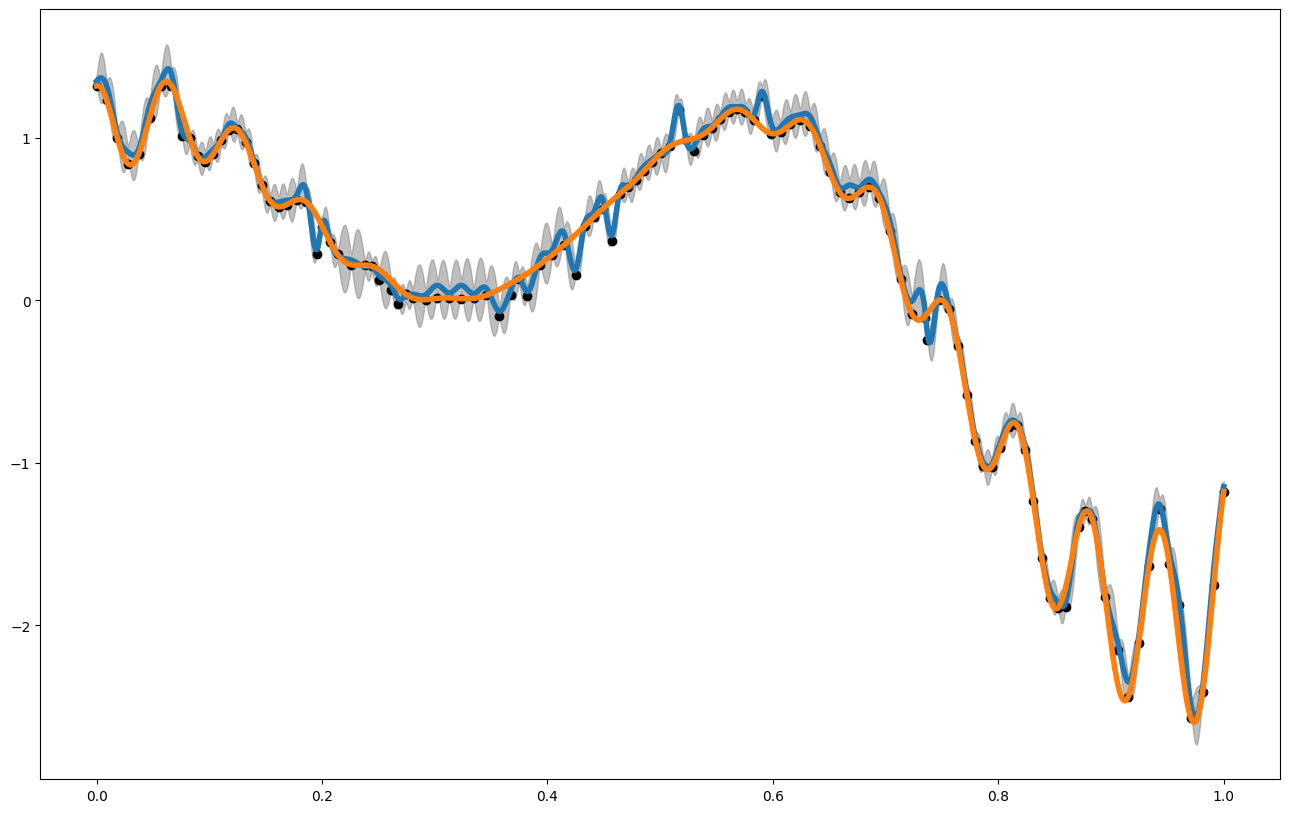
plt.figure(figsize = (16,10))
plt.plot(x_pred,mean1, label = "posterior mean", linewidth = 4)
plt.plot(x_pred1D,f1(x_pred1D), label = "latent function", linewidth = 4)
plt.fill_between(x_pred, mean1 - 3. * np.sqrt(var1), mean1 + 3. * np.sqrt(var1), alpha = 0.5, color = "grey", label = "var")
plt.scatter(my_gp.x_data,my_gp.y_data, color = 'black')
plt.show()
##looking at some validation metrics
print("RMSE: ",my_gp.rmse(x_pred1D,f1(x_pred1D).flatten()))
print("NRMSE: ",my_gp.nrmse(x_pred1D,f1(x_pred1D).flatten()))
print("CRPS (mean, std): ",my_gp.crps(x_pred1D,f1(x_pred1D).flatten()))
print("R2: ",my_gp.r2(x_pred1D,f1(x_pred1D).flatten()))
print("NLPD: ",my_gp.nlpd(x_pred1D,f1(x_pred1D).flatten()))
print("MSLL: ",my_gp.msll(x_pred1D,f1(x_pred1D).flatten()))
print("MAPE: ",my_gp.mape(x_pred1D,f1(x_pred1D).flatten()))
print("INTERVAL SCORE: ",my_gp.interval_score(x_pred1D,f1(x_pred1D).flatten()))
print("MPIW: ",my_gp.mpiw(x_pred1D))
print("PICP: ",my_gp.picp(x_pred1D,f1(x_pred1D).flatten()))
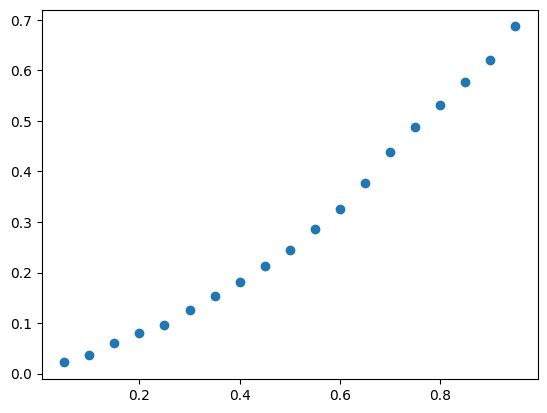
print("Coverage Curve:")
cov_curve = my_gp.coverage_curve(x_pred1D,f1(x_pred1D).flatten())
plt.scatter(cov_curve["target_coverage"], cov_curve["measured_coverage"])
plt.show()
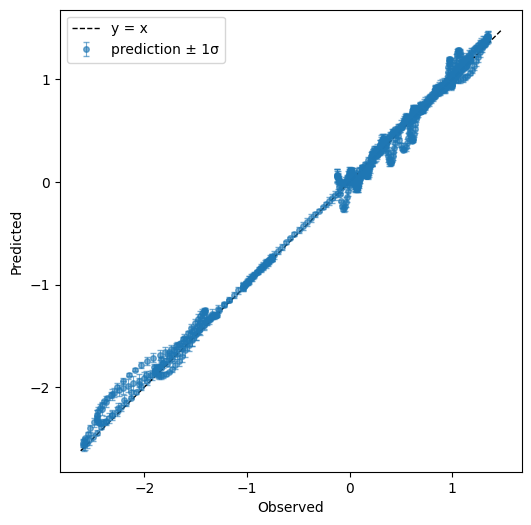
print("predicted vs. observed")
my_gp.plot_observed_vs_predicted(x_pred1D,f1(x_pred1D).flatten())
RMSE:              0.0740259477167942
NRMSE:             0.01876971208312924
CRPS (mean, std):  (np.float64(0.04191006096878285), np.float64(0.04732471889360198))
R2:                0.9948529555765062
NLPD:              4.497537710667229
MSLL:              3.0464068599702556
MAPE:              0.7534770749929869
INTERVAL SCORE:    0.7720827221748209
MPIW:              0.1269163874679859
PICP:              0.687
Coverage Curve:
predicted vs. observed