

gpOptimizer Multi-Task Test#
At first we have to install the newest version of gpCAM
## First, install the newest version of gpcam and some plotting tools
#!pip install gpCAM==8.4.0
#!pip install matplotlib
#!pip install plotly
Setup#
import numpy as np
import matplotlib.pyplot as plt
from gpcam import fvGPOptimizer
import plotly.graph_objects as go
import plotly.io as pio
pio.renderers.default = "png"
from itertools import product
from distributed import Client
client = Client()

%load_ext autoreload
%autoreload 2
Simple 1d Example#
Data#
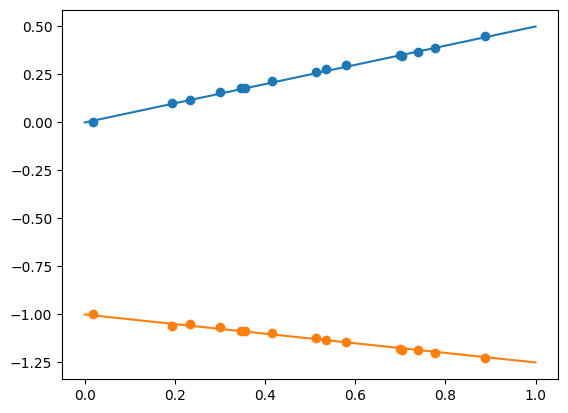
def f1(x): return 0.5 * x
def f2(x): return (-.25 * x) - 1.

x_pred1d = np.linspace(0,1,50)
plt.plot(x_pred1d,f1(x_pred1d))
plt.plot(x_pred1d,f2(x_pred1d))
x_data = np.random.rand(15)
y_data1 = f1(x_data) + np.random.uniform(low = -0.01, high = 0.01, size =len(x_data))
y_data2 = f2(x_data) + np.random.uniform(low = -0.01, high = 0.01, size =len(x_data))
plt.scatter(x_data,y_data1)
plt.scatter(x_data,y_data2)
plt.show()
GP initialization#
my_gp2 = fvGPOptimizer(x_data.reshape(len(x_data),1), np.column_stack([y_data1, y_data2]))
print("Hybrid Training in progress")
my_gp2.train(max_iter = 20, method = "hgdl", dask_client=client)

print("MCMC Training in progress")
my_gp2.train(max_iter = 20, method = "mcmc")

print("Local Training in progress")
my_gp2.train(max_iter = 20, method = "local")

print("Global Training in progress")
my_gp2.train(max_iter = 20, method="global")
/home/marcus/Coding/fvGP/fvgp/gp.py:375: UserWarning:

Hyperparameters initialized to a vector of ones.

/home/marcus/Coding/fvGP/fvgp/gp.py:406: UserWarning:

No noise function or measurement noise provided. Noise variances will be set to (0.01 * mean(|y_data|))^2.

/home/marcus/Coding/fvGP/fvgp/gp.py:759: UserWarning:

Default hyperparameter_bounds initialized because none were provided. This will fail for custom kernel, mean, or noise functions
Hybrid Training in progress
MCMC Training in progress
Local Training in progress
Global Training in progress
/home/marcus/Coding/fvGP/fvgp/gp.py:759: UserWarning:

Default hyperparameter_bounds initialized because none were provided. This will fail for custom kernel, mean, or noise functions
array([1.36698743, 8.70118082, 0.10636079])
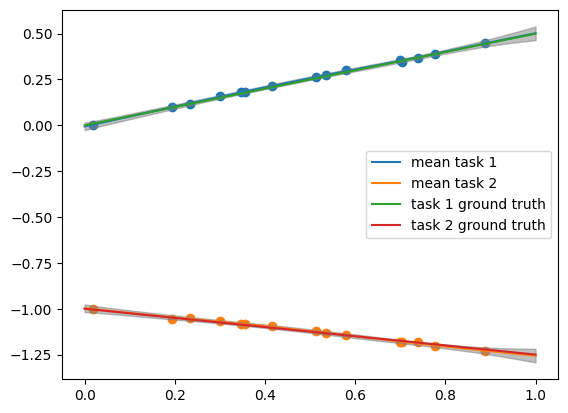
Predictions#
#mean and standard deviation
mean = my_gp2.posterior_mean(x_pred=x_pred1d.reshape(50,1), x_out=np.array([0,1]))["m(x)"]
std = np.sqrt(my_gp2.posterior_covariance(x_pred=x_pred1d.reshape(50,1), x_out=np.array([0,1]))["v(x)"])

plt.plot(x_pred1d.reshape(50,1),mean[:,0], label = "mean task 1")
plt.plot(x_pred1d.reshape(50,1),mean[:,1], label = "mean task 2")
plt.scatter(x_data,y_data1)
plt.scatter(x_data,y_data2)
plt.plot(x_pred1d,f1(x_pred1d), label = "task 1 ground truth")
plt.plot(x_pred1d,f2(x_pred1d), label = "task 2 ground truth")
plt.fill_between(x_pred1d, mean[:,0] - 3. * std[:,0], mean[:,0] + 3. * std[:,0], alpha = 0.5, color = "grey")
plt.fill_between(x_pred1d, mean[:,1] - 3. * std[:,1], mean[:,1] + 3. * std[:,1], alpha = 0.5, color = "grey")
plt.legend()
plt.show()
ask()ing for new actions#
print("asking for the best 2 candidates out of 3:")
print(my_gp2.ask([np.array([0.0]), np.array([0.2]), np.array([1.])], n=2))

print("asking for the best new suggestion across the space [0,1], vectorized=True (default):")
print(my_gp2.ask(np.array([[0.,1.]]), n=1))

print("asking for the best new suggestion across the space [0,1], with vectorization for the global optimizer:")
print(my_gp2.ask(np.array([[0.,1.]]), n=1, vectorized = False))

print("asking for the best new 4 suggestions across the space [0,1] with total correlation:")
print(my_gp2.ask(np.array([[0.,1.]]), n=4, vectorized = False, acquisition_function="total correlation"))

print("asking for an optimized result")
print(my_gp2.ask(np.array([[0.,1.]]), n=30, method = "hgdl", max_iter=100, dask_client=client))
asking for the best 2 candidates out of 3:
{'x': array([[1.],
       [0.]]), 'f_a(x)': array([3.06805272e-04, 9.81869257e-05]), 'opt_obj': None}
asking for the best new suggestion across the space [0,1], vectorized=True (default):
{'x': array([[0.99999675]]), 'f_a(x)': array([0.00030679]), 'opt_obj': None}
asking for the best new suggestion across the space [0,1], with vectorization for the global optimizer:
{'x': array([[0.99999991]]), 'f_a(x)': array([0.0003068]), 'opt_obj': None}
asking for the best new 4 suggestions across the space [0,1] with total correlation:
/home/marcus/Coding/gpCAM/gpcam/gp_optimizer_base.py:430: UserWarning:

I set vectorized=False for total corr. or rel. inf. entropy.
{'x': array([[0.99772223],
       [0.94335478],
       [0.09405528],
       [0.63157152]]), 'f_a(x)': array([-52.89150297]), 'opt_obj': None}
asking for an optimized result
[[1.        ]
 [0.87459217]
 [0.15014446]
 [0.61633181]] [0 1 2 3]
{'x': array([[1.        ],
       [0.87459217],
       [0.15014446],
       [0.61633181]]), 'f_a(x)': array([3.06805272e-04, 5.77229629e-05, 3.68922334e-05, 2.23519118e-05]), 'opt_obj': <hgdl.hgdl.HGDL object at 0x7fa508e63450>}
/home/marcus/Coding/gpCAM/gpcam/surrogate_model.py:114: UserWarning:

An insufficient number of unique optima identified. Try `total correlation` or the use of candidates by providing them as a list to ask().
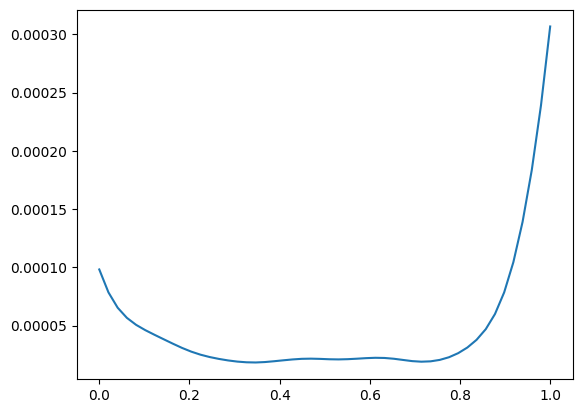
plt.plot(x_pred1d, my_gp2.evaluate_acquisition_function(x_pred1d))
[<matplotlib.lines.Line2D at 0x7fa5083c3310>]
#more ask()s to test:
my_gp2.ask(np.array([[0.,1.]]), n = 1, acquisition_function = 'relative information entropy set', x_out = np.array([0.,1.,2.]), vectorized = True)
my_gp2.ask(np.array([[0.,1.]]), n = 1, acquisition_function = 'relative information entropy', x_out = np.array([0.,1.,2.]), vectorized = True)
my_gp2.ask(np.array([[0.,1.]]), n = 1, acquisition_function = 'variance', x_out = np.array([0.,1.,2.]), vectorized = True)
my_gp2.ask(np.array([[0.,1.]]), n = 1, acquisition_function = 'total correlation', x_out = np.array([0.,1.,2.]), vectorized = True)

my_gp2.ask(np.array([[0.,1.]]), n = 4, acquisition_function = 'relative information entropy set', x_out = np.array([0.,1.,2.]), vectorized = True)
my_gp2.ask(np.array([[0.,1.]]), n = 5, acquisition_function = 'relative information entropy', x_out = np.array([0.,1.,2.]), vectorized = True)
my_gp2.ask(np.array([[0.,1.]]), n = 6, acquisition_function = 'variance', x_out = np.array([0.,1.,2.]), vectorized = True)
my_gp2.ask(np.array([[0.,1.]]), n = 2, acquisition_function = 'total correlation', x_out = np.array([0.,1.,2.]), vectorized = True)
/home/marcus/Coding/gpCAM/gpcam/gp_optimizer_base.py:426: UserWarning:

You specified n>1 and method != 'hgdl' in ask(). The acquisition function has therefore been changed to 'total correlation'.
{'x': array([[0.99991077],
        [0.09127145]]),
 'f_a(x)': array([-25.51340188]),
 'opt_obj': None}
Communicating data points with missing tasks as lists#
y_data = np.column_stack([y_data1, y_data2])
noise_variances = np.zeros(y_data.shape) + 0.01
y_data[2,0] = np.nan
noise_variances[2,0] = np.nan

y_data[6,1] = np.nan
noise_variances[6,1] = np.nan


my_gp2 = fvGPOptimizer(x_data.reshape(len(x_data),1), y_data, noise_variances=noise_variances)
print("Global Training in progress")
my_gp2.train(max_iter = 20)
Global Training in progress
/home/marcus/Coding/fvGP/fvgp/gp.py:375: UserWarning:

Hyperparameters initialized to a vector of ones.
array([0.57512548, 1.86366365, 0.17072885])
2d Example#
Data#
data = np.load("./data/sim_variable_mod.npy")
sparsification = 4

x_data3 = data[:,5:][::sparsification]
y_data3 = data[:,0:2][::sparsification]

#it is good practice to check the format of the data
print(x_data3.shape)
print(y_data3.shape)
(1583, 3)
(1583, 2)
index = np.where(x_data3[:,2] == 1200.)[0]
x_data3=x_data3[index,0:2]
y_data3=y_data3[index]
for i in range(x_data3.shape[1]):
    x_data3[:,i] = x_data3[:,i] - np.min(x_data3[:,i])
    x_data3[:,i] = x_data3[:,i] / np.max(x_data3[:,i])
x = np.linspace(0,1,100)
y = np.linspace(0,1,100)
x_pred3D = np.asarray(list(product(x, y)))
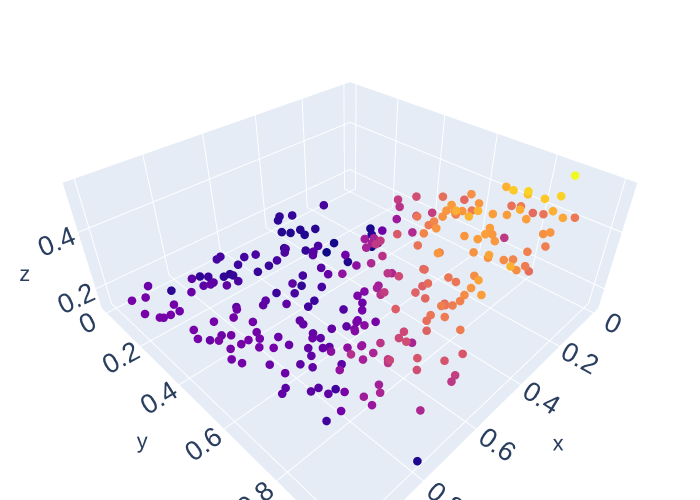
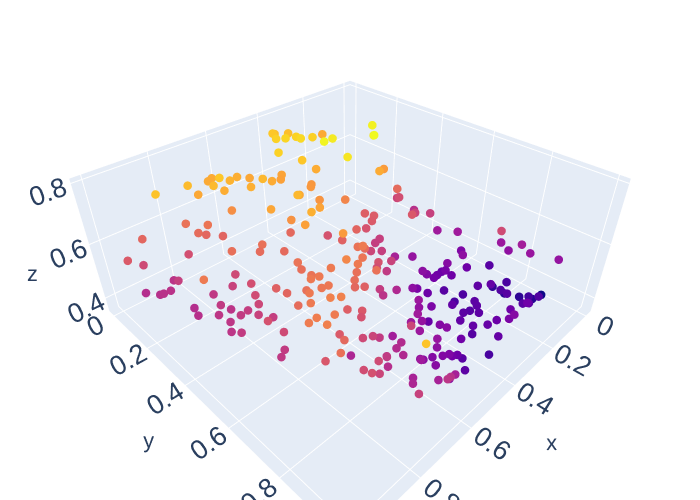
Plotting#
def scatter(x,y,z,size=3, color = 1):
    #if not color: color = z
    fig = go.Figure()
    fig.add_trace(go.Scatter3d(x=x, y=y, z=z,mode='markers',marker=dict(color=color, size = size)))


    fig.update_layout(autosize=False,
                  width=800, height=800,
                  font=dict(size=18,),
                  margin=dict(l=0, r=0, b=0, t=0))
    fig.show()
scatter(x_data3[:,0],x_data3[:,1],y_data3[:,0], size = 5, color = y_data3[:,0])
scatter(x_data3[:,0],x_data3[:,1],y_data3[:,1], size = 5, color = y_data3[:,1])
A simple kernel definition#
It is vital in the multi-task case to think hard about kernel design. The kernel is now a function over X x X x T x T, where X is the input and T is the output space. Print the input into the kernel, it will have the dimensionality of this cartesian product space. The default kernel is just a Matern kernel in input and output directions.
#As imple kernel, that won't lead to good performance because its stationary
def mkernel(x1,x2,hps,obj):
    d = obj.get_distance_matrix(x1,x2)
    return hps[0] * obj.matern_kernel_diff1(d,hps[1])
Initialization#
(a) Default behavior#
from fvgp import fvGP

my_gp2 = fvGPOptimizer(x_data3,y_data3,)
print("Global Training in progress")
my_gp2.train(max_iter = 2)
Global Training in progress
/home/marcus/Coding/fvGP/fvgp/gp.py:375: UserWarning:

Hyperparameters initialized to a vector of ones.

/home/marcus/Coding/fvGP/fvgp/gp.py:406: UserWarning:

No noise function or measurement noise provided. Noise variances will be set to (0.01 * mean(|y_data|))^2.

/home/marcus/Coding/fvGP/fvgp/gp.py:759: UserWarning:

Default hyperparameter_bounds initialized because none were provided. This will fail for custom kernel, mean, or noise functions
array([0.01019757, 9.42323738, 9.90785887, 0.68720784])
(b) Simple custom kernel#
#A simple kernel, that won't lead to good performance because it's stationary
from gpcam.kernels import *
def mkernel(x1,x2,hps):
    d = get_distance_matrix(x1,x2)
    return hps[0] * matern_kernel_diff1(d,hps[1])
my_gp2 = fvGPOptimizer(x_data3,y_data3,
              init_hyperparameters=np.ones((2)), kernel_function=mkernel
             )
print("Global Training in progress")


bounds = np.array([[0.01,1.],[0.01,1.]])
my_gp2.train(hyperparameter_bounds=bounds,max_iter = 2)
Global Training in progress
array([1., 1.])
(c) Deep kernel#
from gpcam.deep_kernel_network import *
iset_dim = 3
gp_deep_kernel_layer_width = 5
n = Network(iset_dim, gp_deep_kernel_layer_width)
print(n.number_of_hps)

def deep_multi_task_kernel(x1, x2, hps):  # pragma: no cover
    signal_var = hps[0]
    length_scale = hps[1]
    hps_nn = hps[2:]
    w1_indices = np.arange(0, gp_deep_kernel_layer_width * iset_dim)
    last = gp_deep_kernel_layer_width * iset_dim
    w2_indices = np.arange(last, last + gp_deep_kernel_layer_width ** 2)
    last = last + gp_deep_kernel_layer_width ** 2
    w3_indices = np.arange(last, last + gp_deep_kernel_layer_width * iset_dim)
    last = last + gp_deep_kernel_layer_width * iset_dim
    b1_indices = np.arange(last, last + gp_deep_kernel_layer_width)
    last = last + gp_deep_kernel_layer_width
    b2_indices = np.arange(last, last + gp_deep_kernel_layer_width)
    last = last + gp_deep_kernel_layer_width
    b3_indices = np.arange(last, last + iset_dim)

    n.set_weights(hps_nn[w1_indices].reshape(gp_deep_kernel_layer_width, iset_dim),
                  hps_nn[w2_indices].reshape(gp_deep_kernel_layer_width, gp_deep_kernel_layer_width),
                  hps_nn[w3_indices].reshape(iset_dim, gp_deep_kernel_layer_width))
    n.set_biases(hps_nn[b1_indices].reshape(gp_deep_kernel_layer_width),
                 hps_nn[b2_indices].reshape(gp_deep_kernel_layer_width),
                 hps_nn[b3_indices].reshape(iset_dim))
    x1_nn = n.forward(x1)
    x2_nn = n.forward(x2)
    d = get_distance_matrix(x1_nn, x2_nn)
    k = signal_var * matern_kernel_diff1(d, length_scale)
    return k


my_gp2 = fvGPOptimizer(x_data3,y_data3,
              init_hyperparameters=np.ones((n.number_of_hps+2))*0.1, kernel_function=deep_multi_task_kernel
             )
print("Global Training in progress")


bounds = np.zeros((n.number_of_hps+2,2))
bounds[0] = np.array([0.01,1.])
bounds[1] = np.array([0.1,1.])
bounds[2:] = np.array([-1,1])
my_gp2.train(hyperparameter_bounds=bounds,max_iter = 1000, method = "mcmc")
68
Global Training in progress
/home/marcus/Coding/fvGP/fvgp/gp.py:406: UserWarning:

No noise function or measurement noise provided. Noise variances will be set to (0.01 * mean(|y_data|))^2.
array([ 0.27595116,  0.1295122 ,  0.38557892,  0.19566903,  0.25186947,
       -0.39016978,  0.57679159,  0.37868308, -0.01876372, -0.1617492 ,
        0.08333096, -0.78837228,  0.01181304,  0.35668674, -0.43876624,
       -0.03914357,  0.14375908,  0.55221906, -0.02073137,  0.3244594 ,
        0.58323974, -0.2883432 ,  0.43994579,  0.58163794,  0.27964831,
        0.19263106,  0.52268566,  0.42695684,  0.88718882,  0.31088493,
       -0.04516356, -0.39017165,  0.20623704,  0.27911969,  0.22969668,
       -0.16971989, -0.32881768, -0.34097338, -0.03537158, -0.42234119,
        0.51240024, -0.18621242,  0.49835545, -0.49822246,  0.83688839,
        0.75008652, -0.28759756,  0.80928913,  0.53255292,  0.29193801,
       -0.14782615,  0.25534963,  0.27652075,  0.52437864, -0.14694326,
        0.38962819, -0.67423801, -0.72464246,  0.70585347,  0.30394016,
       -0.25726886,  0.39556614,  0.0568369 ,  0.28043719,  0.41346594,
        0.34518988,  0.52927907,  0.45311568,  0.31745453,  0.17159254])
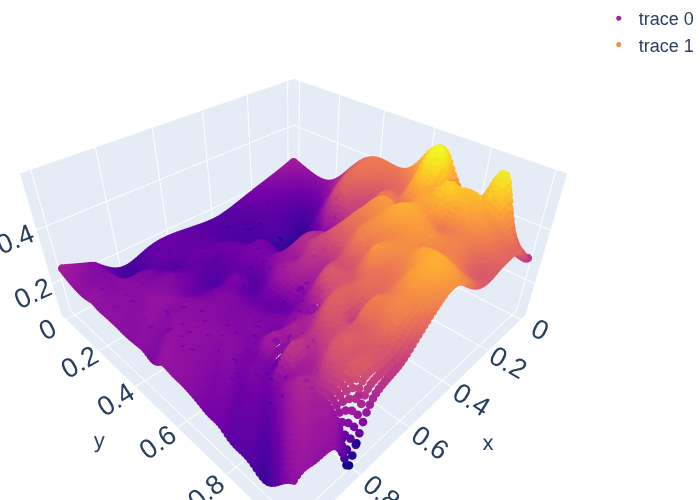
Prediction#
mean = my_gp2.posterior_mean(x_pred3D)["m(x)"]
var =  my_gp2.posterior_covariance(x_pred3D)["v(x)"]
fig = go.Figure()
fig.add_trace(go.Scatter3d(x=x_pred3D[:,0],y=x_pred3D[:,1], z=mean[:,0],
mode='markers',marker=dict(color=mean[:,0], size = 5)))
fig.add_trace(go.Scatter3d(x=x_data3[:,0], y=x_data3[:,1] , z=y_data3[:,0],
mode='markers',marker=dict(color=y_data3[:,0], size = 5)))
fig.update_layout(autosize=False,
width=800, height=800,
font=dict(size=18,),
margin=dict(l=0, r=0, b=0, t=0))
fig.show()
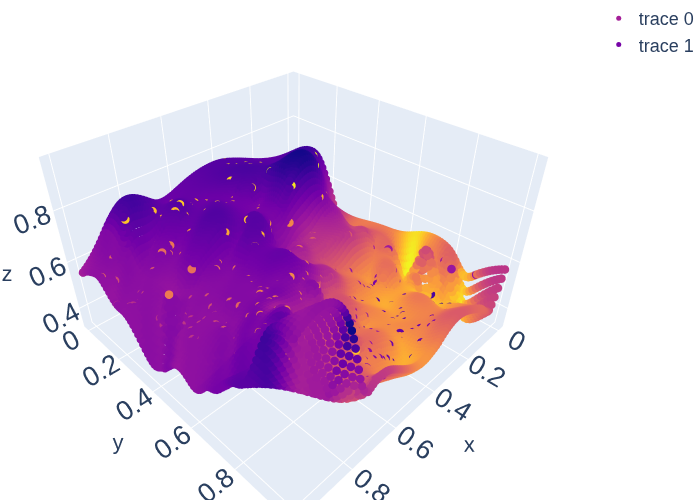
fig = go.Figure()
fig.add_trace(go.Scatter3d(x=x_pred3D[:,0],y=x_pred3D[:,1], z=mean[:,1],
mode='markers',marker=dict(color=mean[:,0], size = 5)))
fig.add_trace(go.Scatter3d(x=x_data3[:,0], y=x_data3[:,1] , z=y_data3[:,1],
mode='markers',marker=dict(color=y_data3[:,1], size = 5)))
fig.update_layout(autosize=False,
width=800, height=800,
font=dict(size=18,),
margin=dict(l=0, r=0, b=0, t=0))
fig.show()
print("n=1")
my_gp2.ask(np.array([[0,1],[0,1]]), n = 1, max_iter=2,pop_size=2, info = True,
           acquisition_function = 'relative information entropy set', x_out = np.array([0.,1.]), vectorized = True)
my_gp2.ask(np.array([[0,1],[0,1]]), n = 1, max_iter=2,pop_size=2, info = True,
           acquisition_function = 'relative information entropy', x_out = np.array([0.,1.]), vectorized = True)
my_gp2.ask(np.array([[0,1],[0,1]]), n = 1, max_iter=2,pop_size=2,info = True,
           acquisition_function = 'variance', x_out = np.array([0.,1.]), vectorized = True)
my_gp2.ask(np.array([[0,1],[0,1]]), n = 1, max_iter=2,pop_size=2,info = True,
           acquisition_function = 'total correlation', x_out = np.array([0.,1.]), vectorized = True)

print("n>1")
my_gp2.ask(np.array([[0,1],[0,1]]), n = 4, max_iter=2,pop_size=2,info = True,
           acquisition_function = 'relative information entropy set', x_out = np.array([0.,1.]), vectorized = True)
my_gp2.ask(np.array([[0,1],[0,1]]), n = 5, max_iter=2,pop_size=2,info = True,
           acquisition_function = 'relative information entropy', x_out = np.array([0.]), vectorized = True)
my_gp2.ask(np.array([[0,1],[0,1]]), n = 3, max_iter=2,pop_size=2,info = True,
           acquisition_function = 'variance', x_out = np.array([0.,1.]), vectorized = True)
my_gp2.ask(np.array([[0,1],[0,1]]), n = 2, max_iter=2,pop_size=2,info = True,
           acquisition_function = 'total correlation', vectorized = True)
n=1
differential_evolution step 1: f(x)= 190.83465826559407
differential_evolution step 2: f(x)= 46.544094680963866
differential_evolution step 1: f(x)= 2.356589048353653
differential_evolution step 2: f(x)= 2.356589048353653
differential_evolution step 1: f(x)= -0.029409750894944298
differential_evolution step 2: f(x)= -0.029409750894944298
/home/marcus/Coding/gpCAM/gpcam/gp_optimizer_base.py:430: UserWarning:

I set vectorized=False for total corr. or rel. inf. entropy.
differential_evolution step 1: f(x)= 4.546415867898986
differential_evolution step 2: f(x)= 4.546415867898986
n>1
/home/marcus/Coding/gpCAM/gpcam/gp_optimizer_base.py:426: UserWarning:

You specified n>1 and method != 'hgdl' in ask(). The acquisition function has therefore been changed to 'total correlation'.
differential_evolution step 1: f(x)= 15.766742951470064
differential_evolution step 2: f(x)= 15.204044747287867
differential_evolution step 1: f(x)= 743.727905707668
differential_evolution step 2: f(x)= 292.4779504424121
differential_evolution step 1: f(x)= 12.472259543755968
differential_evolution step 2: f(x)= 12.472259543755968
differential_evolution step 1: f(x)= 7.988322167745594
differential_evolution step 2: f(x)= 5.725134560444587
{'x': array([[0.7995159 , 0.0474211 ],
        [0.04348764, 0.16418163]]),
 'f_a(x)': array([-5.72513456]),
 'opt_obj': None}